
fx Cookbook #2: Reading Inputs, User Interface Contd, Etc
This is part 2 of the FX Cookbook on creating a slick, functional operator interface for ShowIO devices. If you haven’t read part 1, I highly recommend starting there!
We left the last FX cookbook on a cliffhanger. We’ve started set up bare-bones control for our digital outputs, allowing for our escape room operators to trigger effects from their workstations. However, we lack any sort of feedback; we can’t tell what digital inputs are active, and we don’t have a way to see if the digital outputs have been triggered. If we can show that information to the operator, we’ll give them another window into how a team is progressing in an escape room, and provide valuable troubleshooting data if something has gone wrong. This cookbook is all about getting set up to get the data we need to put the ShowIO devices into use—in the next FX Cookbook, we’ll revisit our hypothetical escape room, and put everything we’ve learned together into something that you can deploy in the real world.
Reading Digital Inputs
Setting Up
Whether we plan to do complicated routing or manipulation of the data that’s coming in from our digital inputs or not, the first step is making sure that the Node-RED server is receiving data from the ShowIO devices. I’m using the same setup as I used in FX Cookbook #1—I have four ShowIO devices on a local area network with a Raspberry Pi running Node-RED. I’ve kept the same network configuration setup as well. I like to organize my networked devices in a spreadsheet table for easy reference. Scaling up a networked show control system is easy and fun, but it’s more fun if you’re not trying to figure out which of the 20 IP addresses and 35 ports you need to communicate with when you’re adding a new item.
If you’ve skipped FX Cookbook #1, why? It’s fun, and it would hurt my feelings to know that you’re not reading all my recipes. More importantly, though, I explain how to set up Node-RED with the requisite additional nodes and tell you how to access the interface. Follow those instructions. Once your devices are on the network and you’re in the Node-RED interface, you’re all set to go.
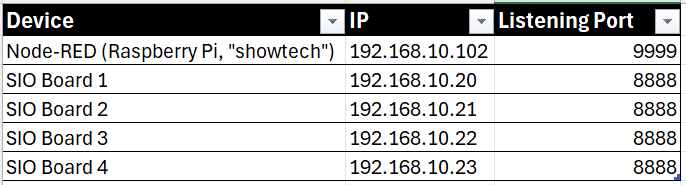
A basic address table in spreadsheet software
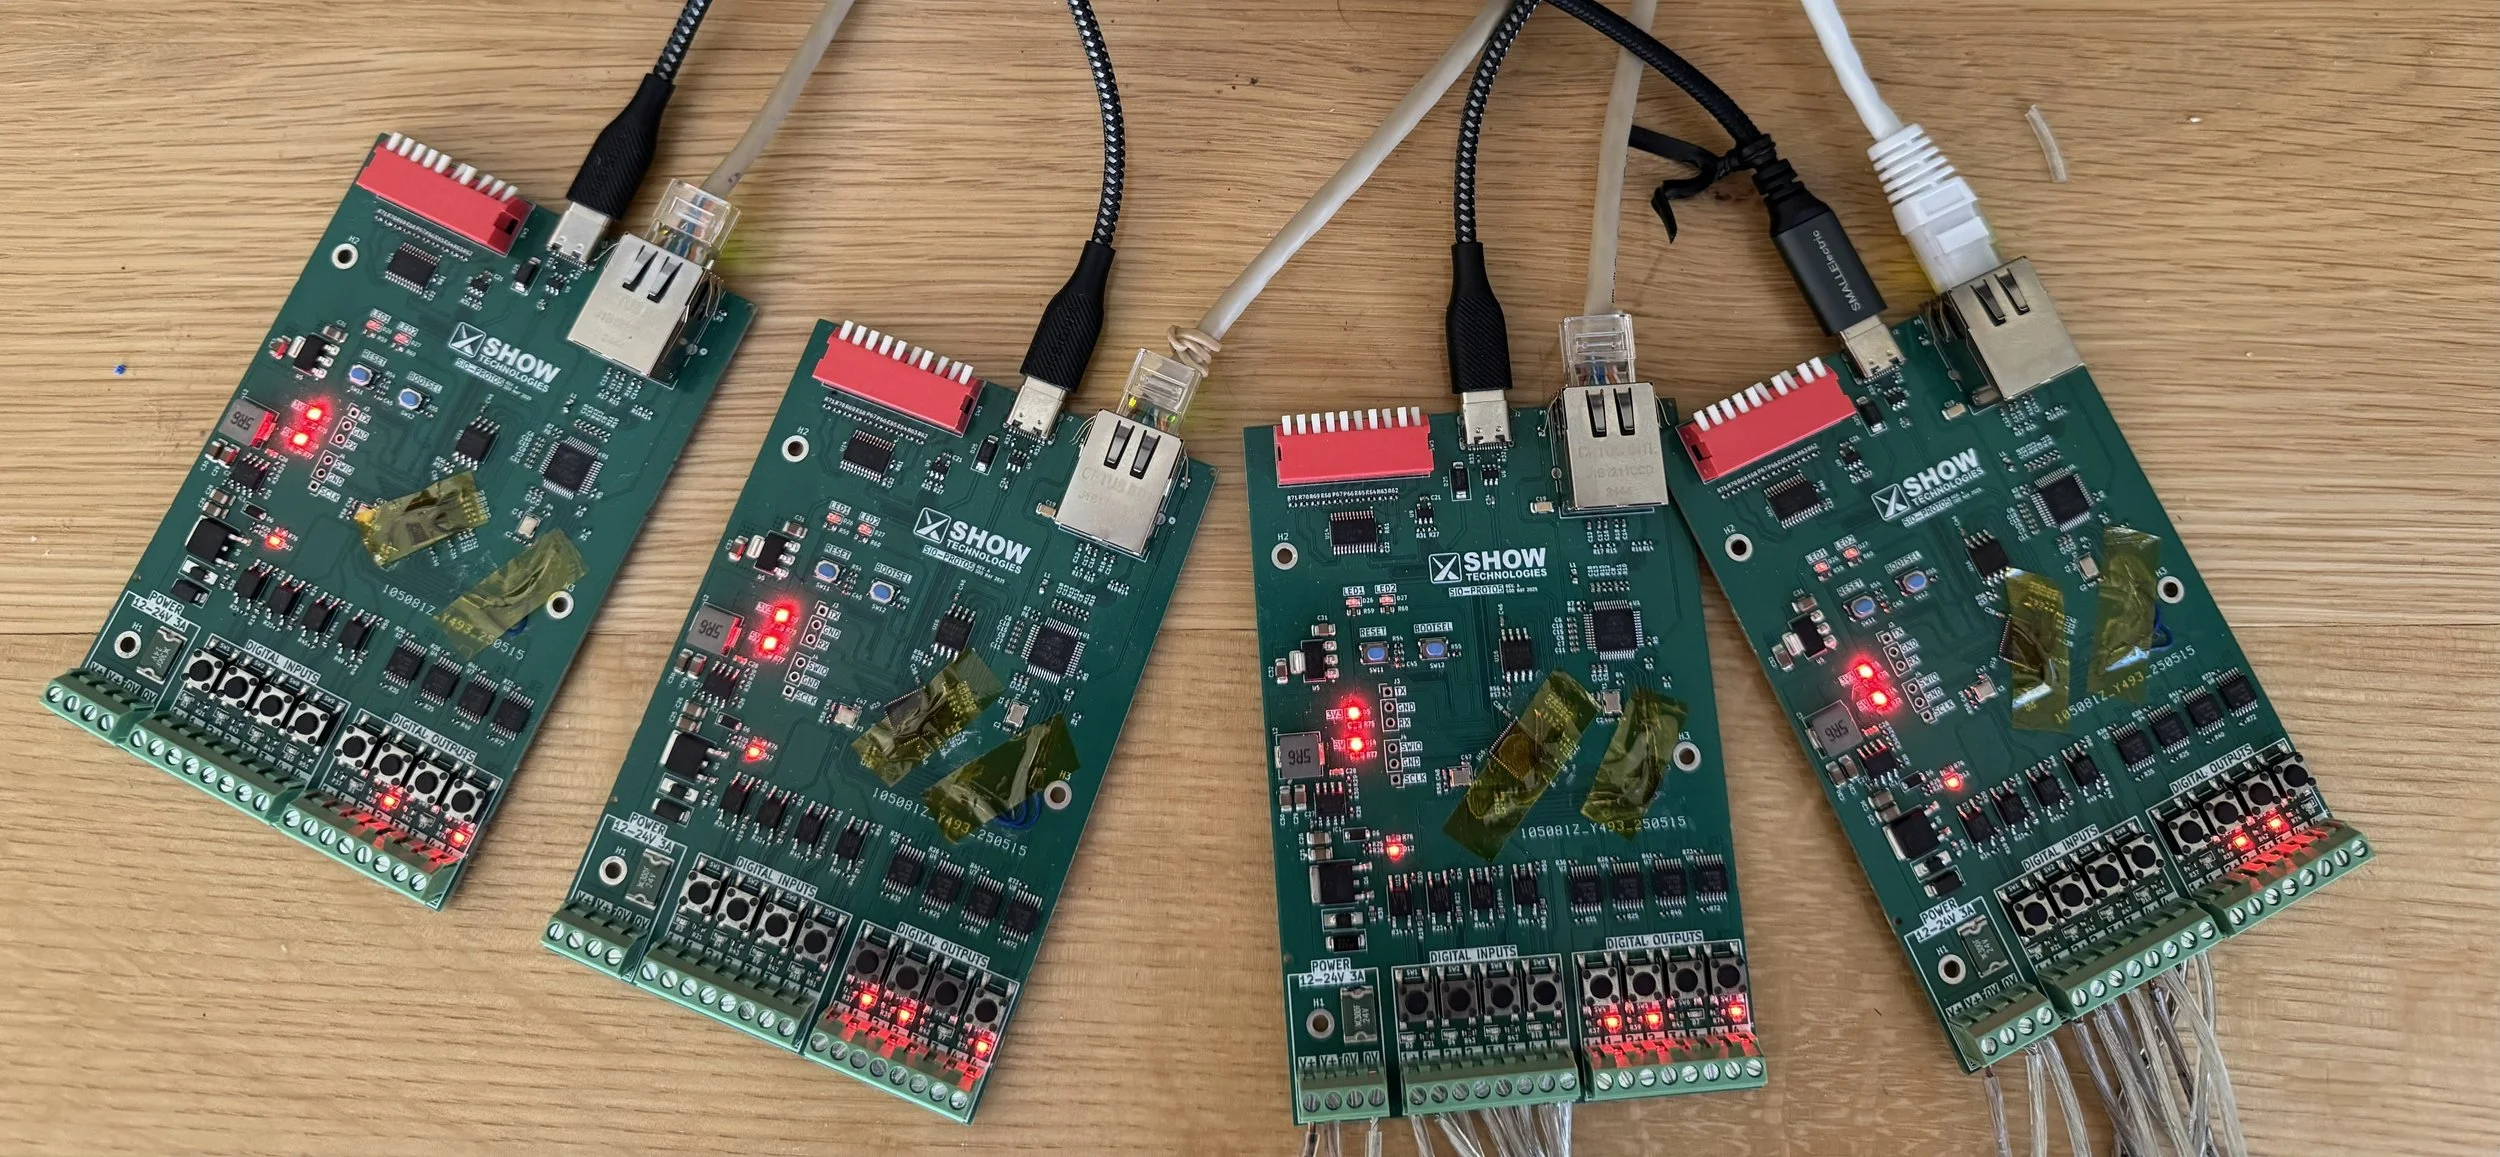
My test setup with four bare boards, addressed as in the table above.
Input to Debug Window node-red Flow
ShowIO devices have multiple ways of reading and reporting the status of their digital inputs. In this case, our server will poll our device for the status of each input. Because these inputs might be as quick as a single button press, though, we want high fidelity data—we’re going to poll our devices a lot.
First, we’ll create our polling flow. This is extremely simple, because we are sending the same message to the device over and over. We need an Inject node going into an OSC node that’s going into a UDP Out node for each device. Configure the UDP Out node with your device’s IP address and port 8888. The inject node needs to send the OSC Address (which we know means the message’s topic, AKA msg.topic) /sio/di/get with NO argument (i.e. no payload.) It will repeat on a .04 second interval, about 25 times per second.
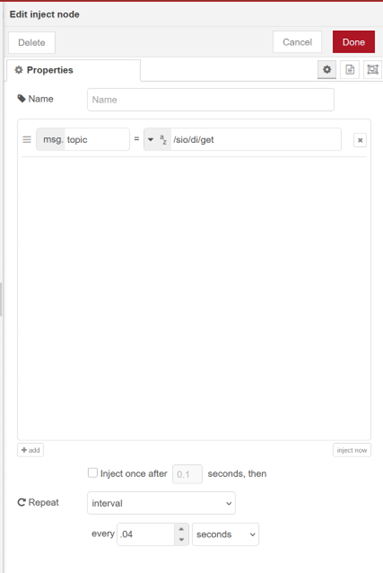
Configured Inject Node with repeat.
Connect them left to right and you’re done!
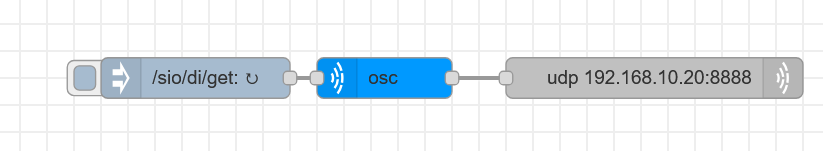
Flow to poll digital input states.
As soon as we deploy this flow, we’ll bombard our devices with requests for their digital input statuses, but we have no way to use the data they’ll send. To start reading that, we’ll need a second flow.
First, we’ll need a new node. So far we’ve only sent OSC over UDP using UDP Out, now that we want to receive OSC over UDP we will, as you may have guessed, use a UDP In node. This node will use your computer’s IP address, so we only need to select a port to listen on. By default, ShowIO devices send to port 9999:
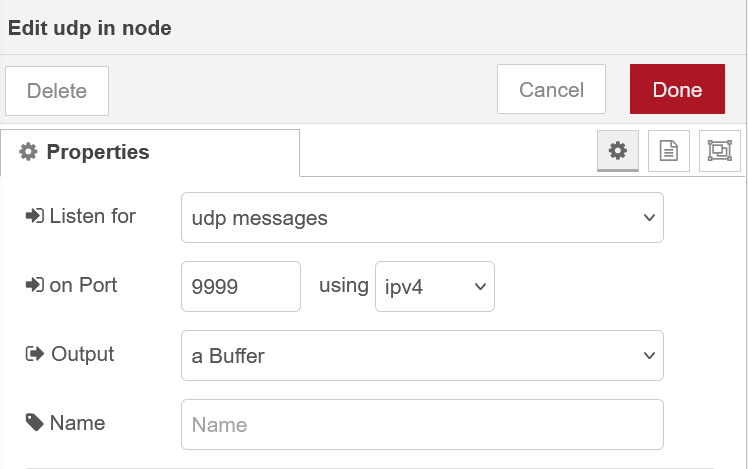
Configured UDP In node.
Every other setting can stay at their defaults. We’ll connect this to another OSC node and a debug node. Configure the debug node to output the complete message object to the debug window.
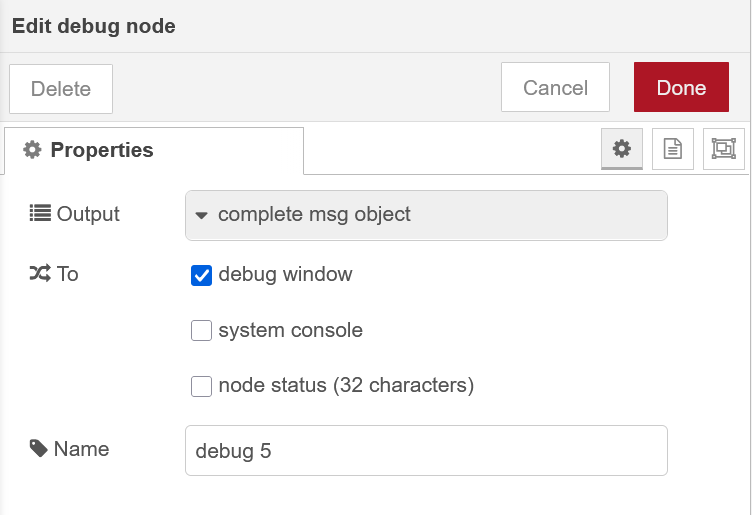
Debug Node configuration.
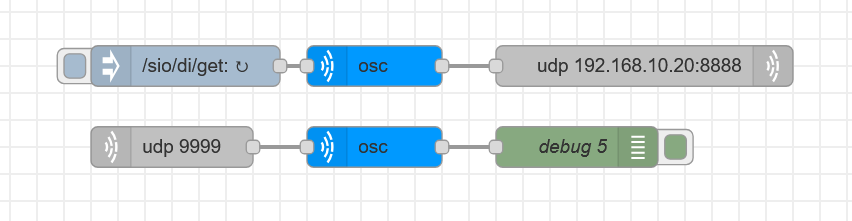
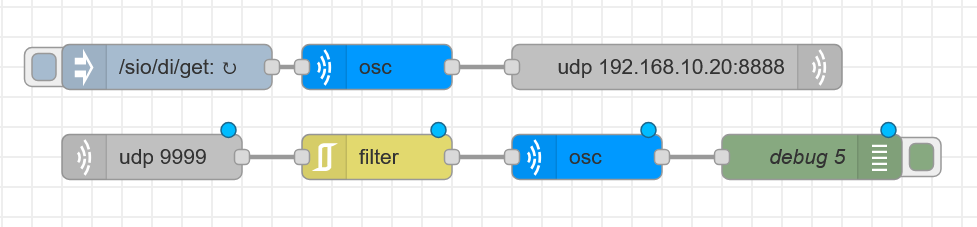
Complete digital input polling flows.
Now we just have to deploy our flows and… be completely overwhelmed by data streaming into our debug window! Disable the Inject node and redeploy your flow to stop the constant stream. That’s obviously an overwhelming amount of data for you as a human being to read. But once you’ve paused the injection, if you open up one of the messages in your debug window, you’ll see that we’re getting what we’re looking for: we have messages from our devices IP address reporting “/sio/di” and then an array of four zeroes (a number in [square brackets] indicates an array of [size.] We have four digital inputs, so we got an array of [4] items.
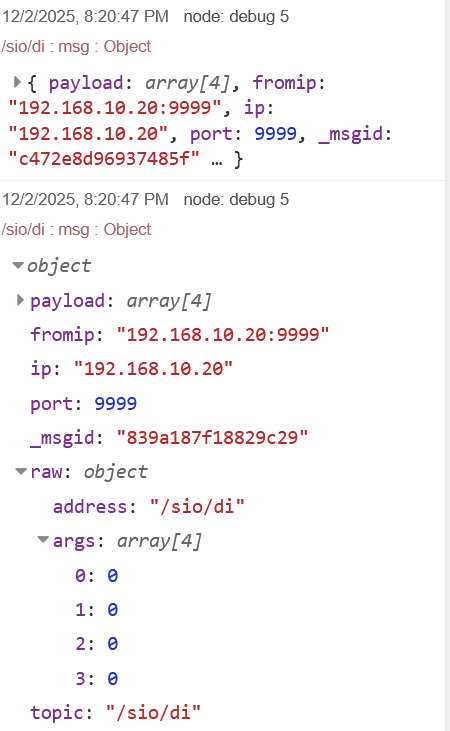
Two digital input state messages as shown in the Node-RED debug window.
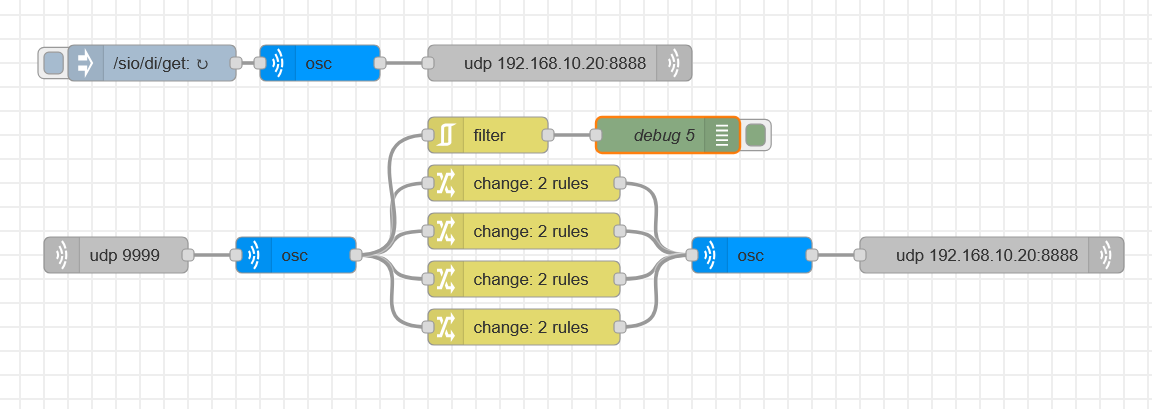
Let’s add a node into our flow to make things more readable. A Filter Node will let us limit the debug output to messages where the payload changes, i.e. an input’s state has changed. Add a Filter node between the UDP In Node and the OSC Node, leave the configuration at its defaults, and redeploy your flow with the injector active.
Filtered digital input polling flows.
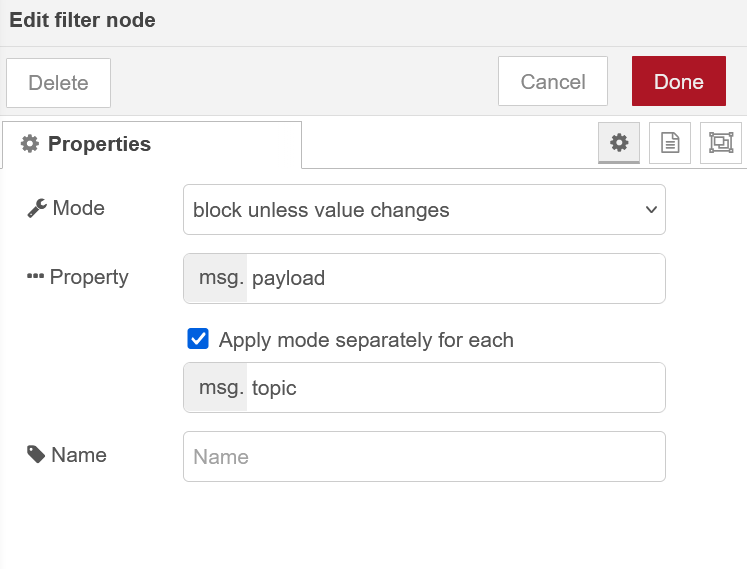
Filter Node configuration.
You should get only one message in the debug window at the first data injection. Now when you trigger inputs on your device, you’ll see the change appear in your debug window.
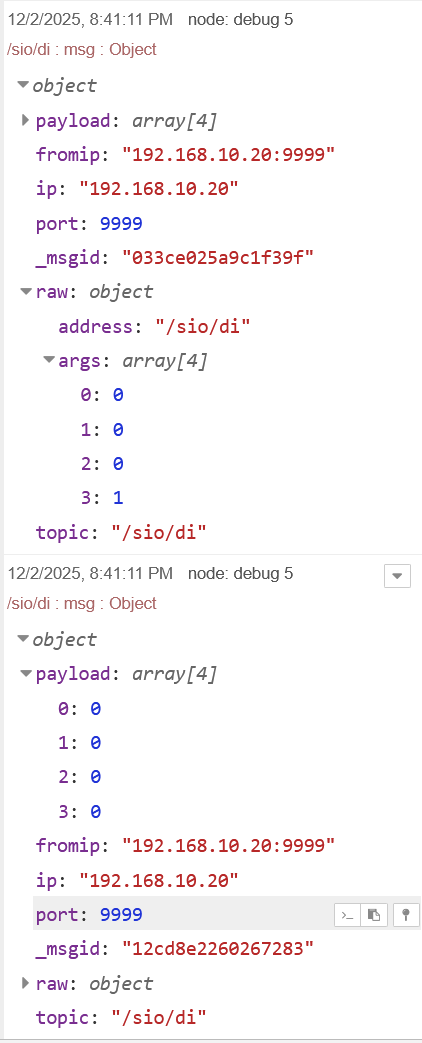
Debug output demonstrating that messages are only displayed when a digital input state changes. In this case, input 4 has gone from 1 (on) to 0 (off).
Note that the board is still being polled and responding every .04 seconds, we’re just choosing only to pay attention to changes. Filtering messages is useful in cases where you want high fidelity data to be more easily accessible. Try setting your Debug Node’s output from “complete msg object” to “msg.payload” for an easier to read but less information-rich debug output.
We have been interacting with DOs individually, messaging each one at their own OSC address (e.g. /sio/do/1/set ,i 1). Now that we’re getting a batch of data as an array, we’ll have to pick the data we want out of it. Worth mentioning is that while we tend to count starting at one, computers start at zero, so what we call Digital Input 1 appears in this array as 0. ShowIO devices label our inputs and outputs 1-4 because it’s human friendly, but it does mean that you have to subtract one when dealing with these arrays.
Digital Input Echo Flows
Seeing digital input data stream in is useful for letting us know that our DIs are working, but it’s nicer to have visual feedback. Something like a red light turning on in response to a networked command. If only we had a device on hand that had four output lights…
Right! Let’s put everything we’ve learned thus far together and turn on our device’s outputs in response to digital input triggers. To do this, we’ll get to manipulate the input array data and use a a new node—the Change Node.
Create a UDP In node or copy your existing one, connect it to an OSC node, and drop in a Change node. This change node will let us change the msg.topic, the msg.payload, or both. Remember that topic equals OSC Address and payload equals OSC argument. In this case, we’ll change both to turn on DO 1 when DI 1 is triggered: we’re getting DI polling data with an address /sio/di, and we want to send individual DO values with /sio/do/1/set. We’re also getting an array of arguments, but we only want the argument at payload[0]. To do this, set up two rules in your Change node as follows:
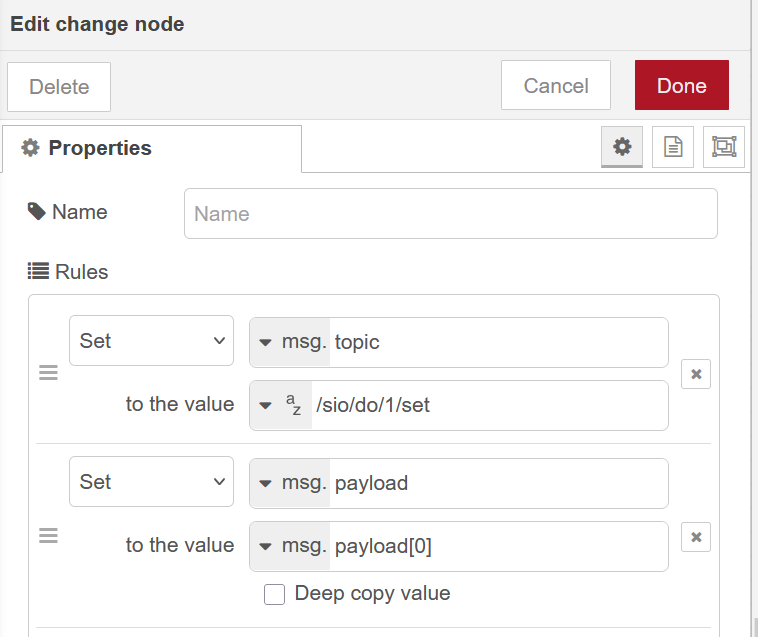
Configured Change Node.
Send the Change node’s output through another OSC node to a UDP Out node that goes to your device. You can copy and paste your Change node 3 more times and set the duplicates up for each DI/DO pairing.
Complete “echo” flows.
Deploy your flow, and try the digital inputs on your device. You should see the digital outputs echo your inputs.
You can see that in my flow, I’ve kept the debug node in but moved the Filter node to only affect messages flowing to the debug node. This way I’m intentionally sending redundant messages to the device, but only get output to the debug window on state changes. Play around with Filter nodes in your message stream and see how they affect performance and reliability.
AUDIBLE USER INTERFACE
THE ULTIMATE IN USER UNFRIENDLINESS
For two FX Cookbooks I’ve promised a slick user interface, and 2700 words in I’m here to tell you that you’re going to have to wait until FX Cookbook #3. What we can put together today, though, is the OPPOSITE of a slick user interface—we will combine the inconvenience of turning DOs on and off individually using inject nodes with the annoyance of a TTS voice audibly reporting state changes for each digital input. We’re doing this for two reasons: first, I find it very funny, and I’m paying for this website and domain. Second, it will introduce the last node I want to talk about today: the Switch node. And we’ll use a lot of Switch nodes.
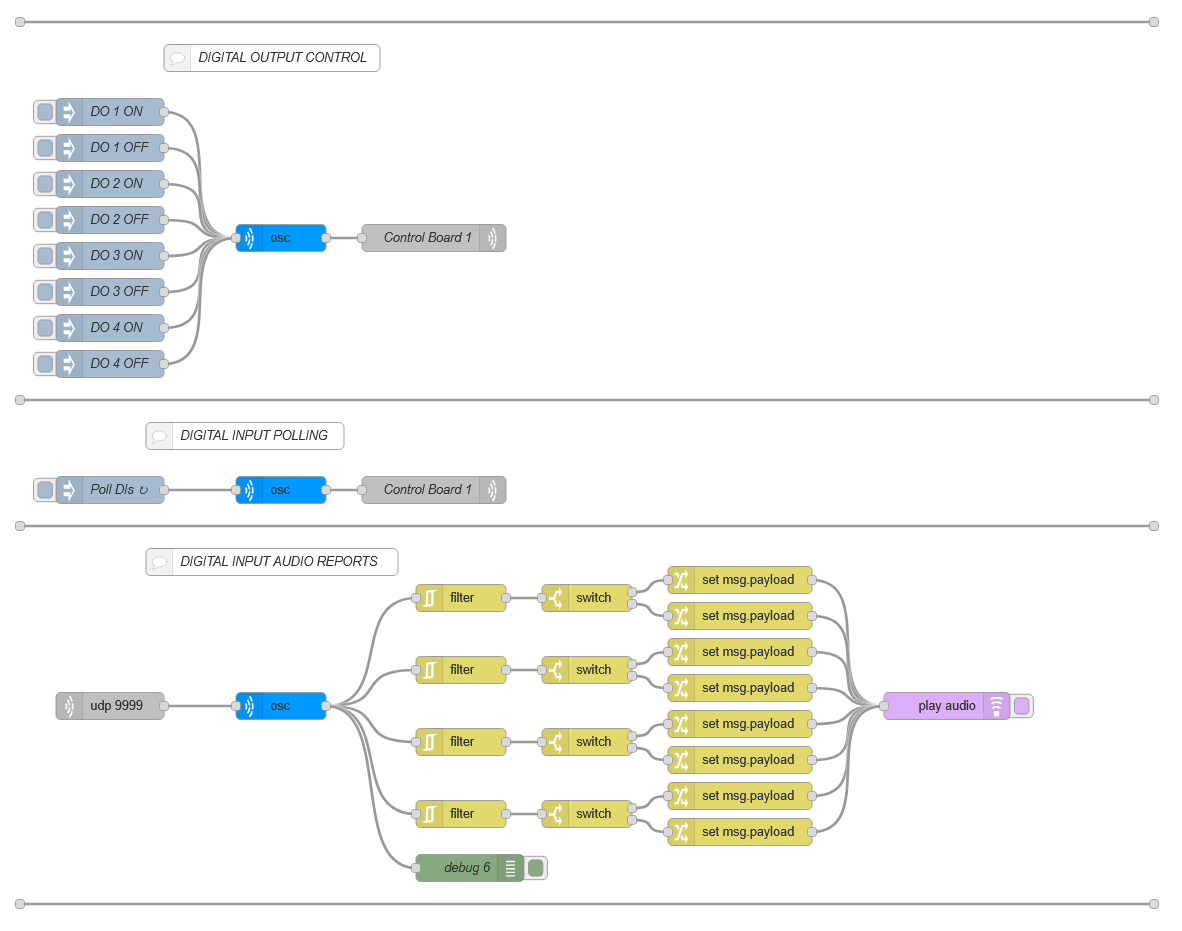
Node-RED flow for audible digital input state change reporting.
A Switch node is roughly equivalent to an if/than statement in traditional programming: “if” something is true about a message, “then” it will be passed along the relevant pathway. You can see in the flow above that each switch node goes to two possible branches.
This flow is complex enough that it’s useful to break down what it will do narratively before we jump into making it in the Node-RED environment. This is similar to writing an outline or pseudo-code for a programming project.
Our goals are to control our device’s digital outputs from our browser, poll our device’s digital inputs, and have our browser read aloud the state of each digital input when it changes.
The first two we know we can accomplish in three nodes. The last one has some more steps, and some complexity that may not be immediately obvious. In this case, we have a known input (/sio/di and an array of values,) so it might be useful to look at the desired output and figure out what needs to happen to each message to get there.
The Play Audio node is looking at the message payload. It can either play a .wav file or read a string aloud with TTS. There are several options for voices, but I like David. It would be nice if David could tell us “Input [number] On” or “Input [number] Off.” In the “echo” flow above, we set our payload from an array to a number. It’s reasonable to assume that setting it to a string will be equally easy. However, in that case we just passed the number through. Here, we should set the string for our voice to read based on the state of the input. “If” input one is on, “then” the voice should say “Input One On.” We also don’t want to voice to try to read the status of every input every .04 seconds, or we are liable to drive ourselves insane.
Each step in the above process neatly maps to a node. We will filter per input so that David only reports changes on individual inputs. If we let messages through any time ANY part of the array changes, David will tell us all four input states any time a single state changes. This gets old quickly. Set each Filter node to a different input; msg.payload[0] through msg.payload[3].
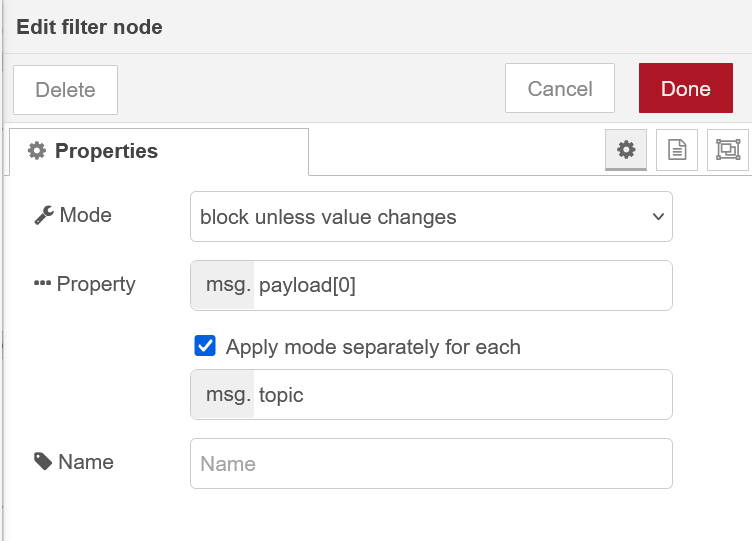
Filter Node configured to allow only messages showing a different value for msg.payload[0] (Digital Input 1) through to the next node.
Next, we will route our filtered messages through based on their input value. If the value is 0 (off,) they go one way, if the value is 1 (on,) they go the other. Place a switch node after your filter node and add two rules, one for msg.payload[0] == 0 and == 1. Repeat for each filter node. Adding a rule will add an output to your switch node; the top rule in your list is the top output. I’ve set the top rule to be “if the input is reporting ‘0’ (off)”, which is important to remember for the next step.
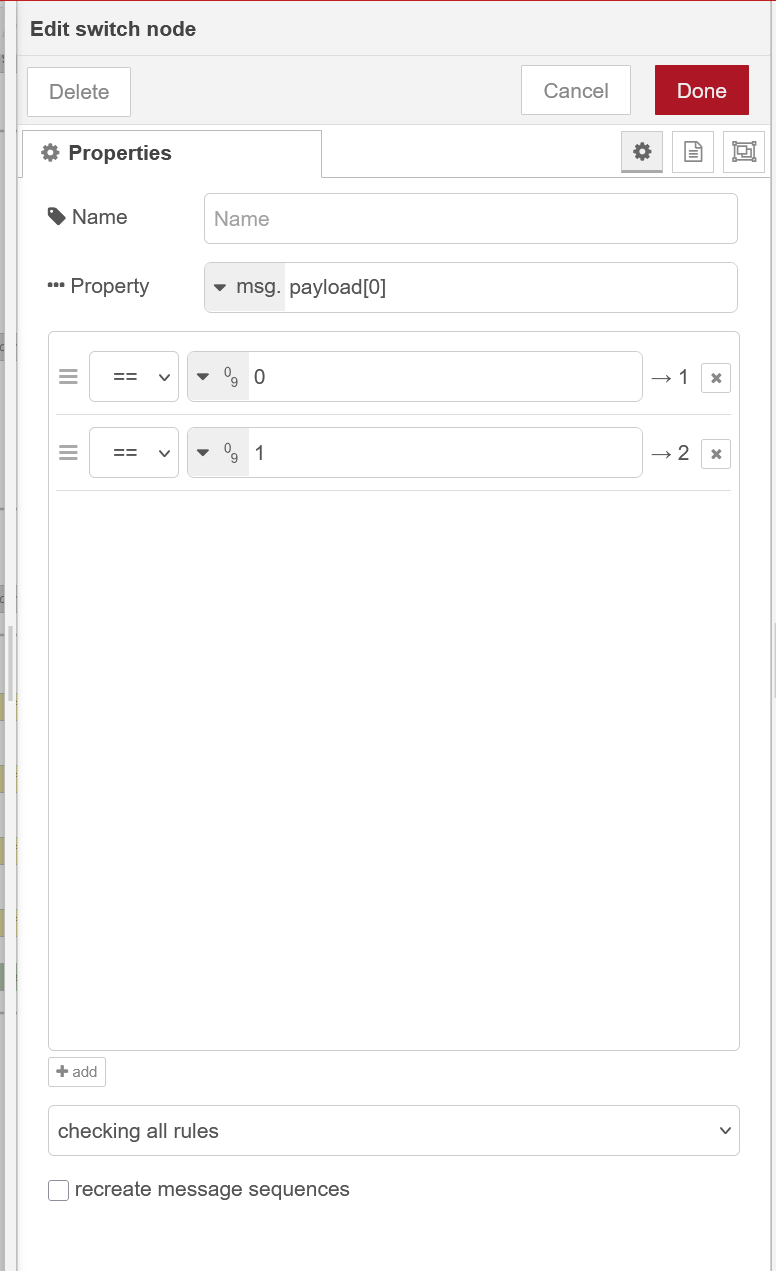
Configured Switch Node. If a message comes in whose msg.payload[0] is 0, it will be routed through the top output. If a message comes in whose msg.payload[0] is 1, it will be routed through the bottom output.
Finally, we need to convert the payload from an array of numbers to a string for David to read. For the top rule on my Digital Input One message path, I want David to say “Input One Off.”
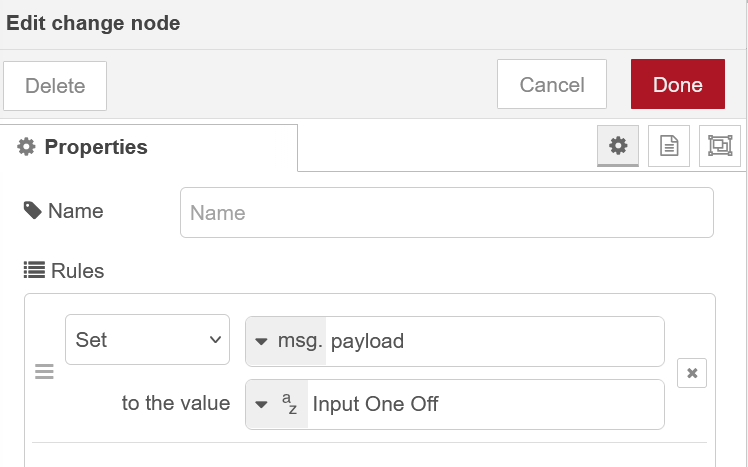
Change node configured to set msg.payload to a string for the Play Audio Node’s TTS reader to read aloud.
Connect that node to the top output of your top switch node and repeat for the other inputs and states. Consider giving yourself a debug node and writing helpful comments for yourself to delineate sections of your flow, and then deploy it. If all goes well, you’ll be able to control your digital outputs from your browser window as before, and every time you trigger a digital input, David will slowly and robotically tell you that you’ve done it. It’s hard to get less user-friendly than that!
Complete flows.
The next FX Cookbook will put all of these things together with some additional features to create a dashboard that will let us create the long-promised user interface, giving us control and up-to-the second data about the states of our devices’ inputs and outputs. Until then, drop me a line at tmarshall@show-technologies.com with any questions, comments, or hate mail!